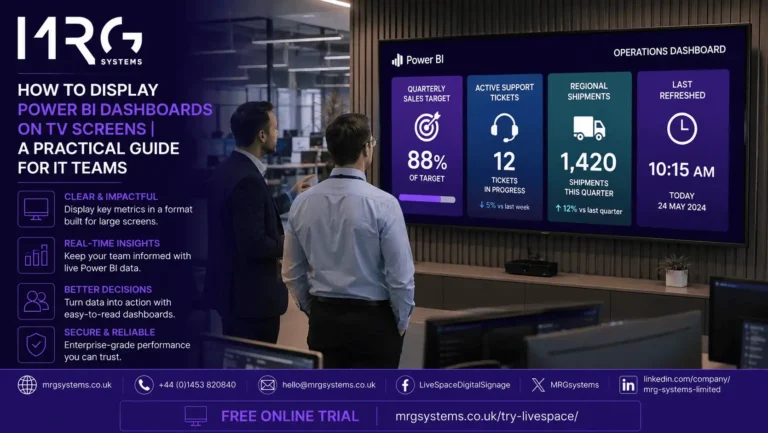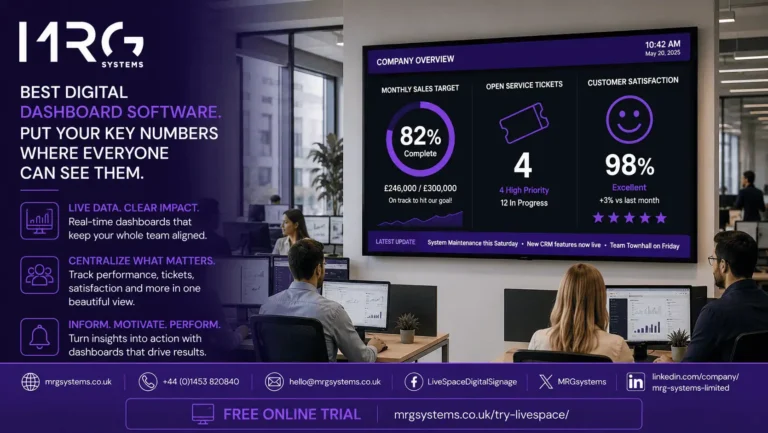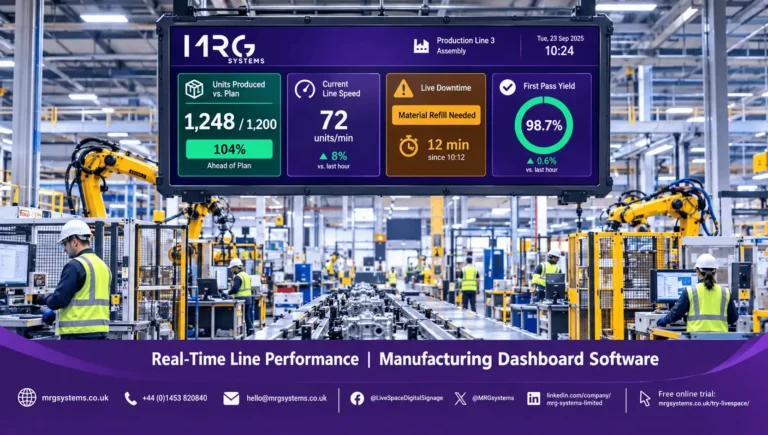

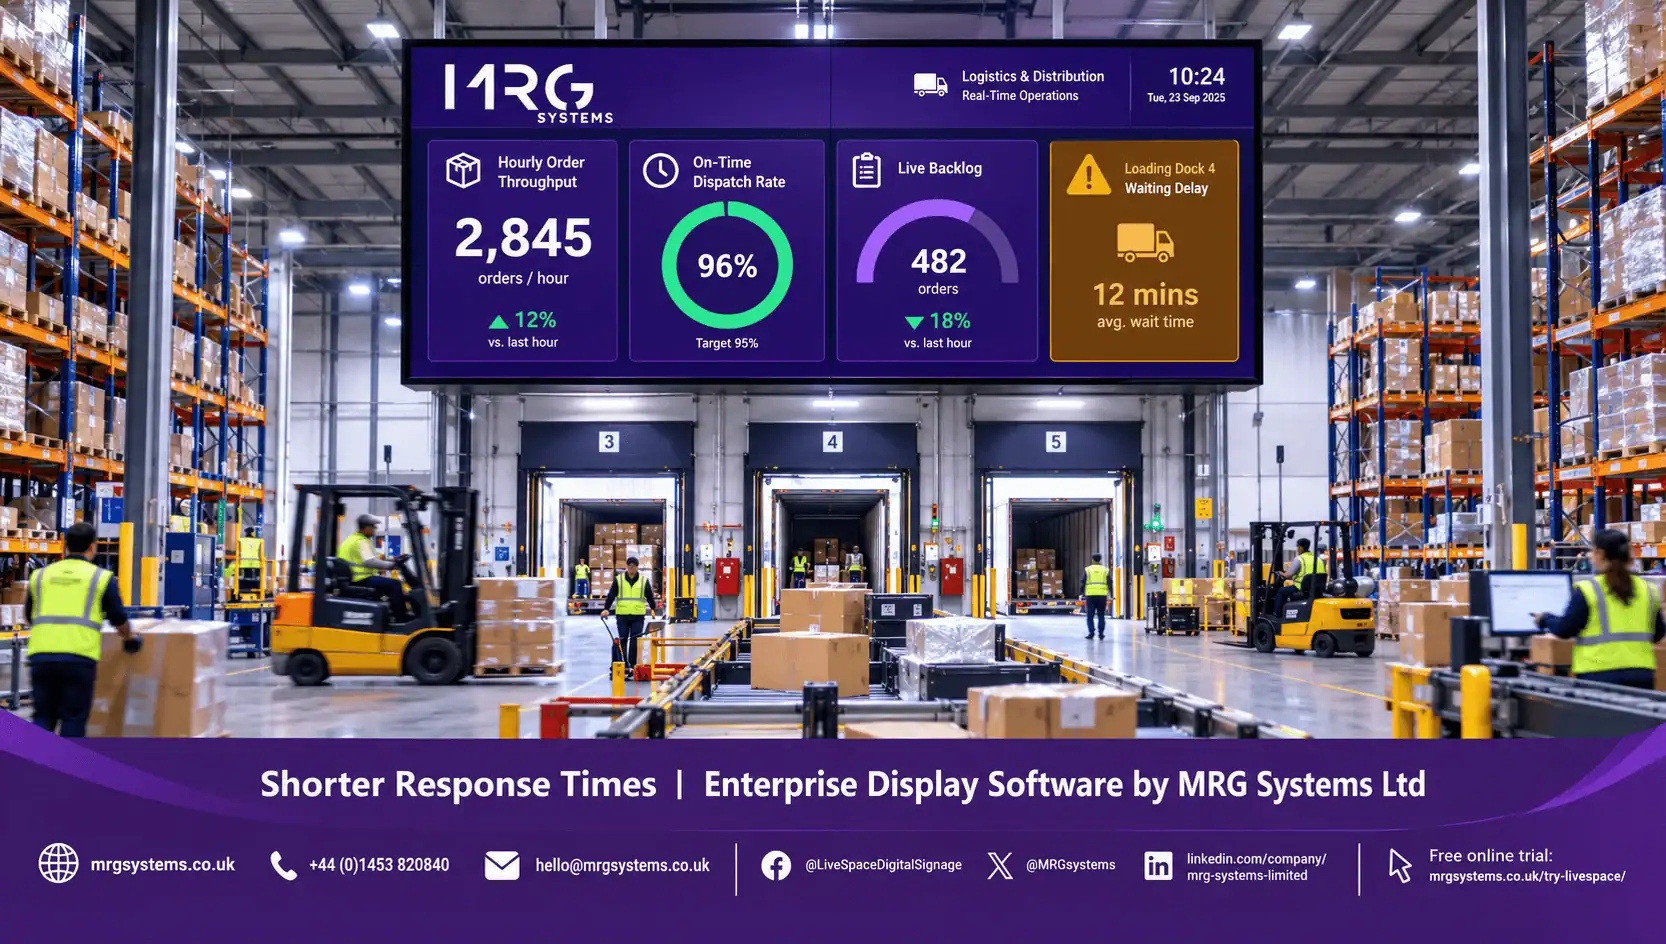
Business analytics display software takes the reports and dashboards that already exist inside an enterprise and puts them on wall screens where decisions are actually made: the operations centre, the trading floor, the distribution hub, the contact centre, the executive suite and the retail store. The aim is simple. Instead of waiting for someone to open a report, the people responsible for a result see the data as it changes and act on it in the same hour.
This article explains why large organisations invest in business analytics display software, how it fits alongside enterprise tools such as Power BI, Tableau and Qlik, what the practical benefits are, and how to run a rollout across many sites. MRG Systems has delivered screen based systems for UK enterprises and public bodies, and the points below reflect the questions those organisations ask.
Enterprises already own analytics platforms. The gap is not analysis; it is visibility. Reports are produced, shared by email or a portal, opened by a small number of people and forgotten.
Business analytics display software closes that gap. It connects to the existing analytics platform (or directly to data sources), presents the chosen dashboards in a format designed for large screens, and manages hundreds of screens across sites from one central console. It is normally delivered as part of wider digital signage solutions, so the same infrastructure also carries corporate communications, safety messaging and customer facing content.
In short: the analytics platform does the thinking, and the display software makes sure people see the result.
Reports are good at explaining what happened. They are poor at changing what is happening now. Three things make wall displays different.
• Shared attention. When a whole team sees the same figure at the same time, response is collective and fast. Nobody has to forward anything.
• Constant presence. A screen in an operations centre is seen thousands of times a day. A report is opened once.
• Zero effort. Nobody needs a login, a link or a spare ten minutes. The information comes to them.
This is why control rooms, network operations centres and retail head offices have used large displays for decades. Business analytics display software brings the same approach to any department at a fraction of the historic cost.
Would you like to see how your existing Power BI or Tableau dashboards look on an enterprise screen wall? Fill in the enquiry form and we will set up a live demonstration.
A stock out in a distribution centre, a surge in inbound calls, a payment gateway failure or a drop in conversion rate on the website is visible within minutes rather than at the next daily review. The cost of a problem is usually proportional to how long it runs unnoticed.
A national operations director can be confident that every regional office is looking at the same figure, defined the same way, refreshed at the same time. Local versions of the truth disappear.
Leadership teams often ask for more reporting. What they usually want is confidence that the business is being watched. A screen in the executive area showing the same operational KPIs the front line sees provides that confidence without adding a single meeting.
Analysts in many enterprises spend a significant share of their week producing status decks. Once the data is live on screens, a large part of that work is no longer needed, and analyst time is redirected to genuine analysis.
Data literacy programmes tend to focus on analysts and managers. Wall screens put data in front of warehouse staff, store colleagues and contact centre agents every day. Over time, people begin to ask better questions because they understand the numbers they are looking at.
• Operations and logistics: throughput, order backlog, on time delivery, vehicle status.
• Customer service: queue length, average handling time, service level, satisfaction.
• Finance: cash position, collections, month end close progress.
• Sales and marketing: pipeline, bookings, campaign performance, web traffic.
• Retail: sales by store, footfall, stock availability, staff scheduling. Head offices often combine this with retail digital signage in stores, so that promotional content and operational data share one management platform.
• IT and security: service status, incident counts, security alerts.
• Executive suite: a small number of headline KPIs across the whole business.
Enterprise IT teams rightly ask how a new display layer fits with what already exists. The key considerations are:
The display software should show existing dashboards from Power BI, Tableau, Qlik, Looker or similar without rebuilding them. It should also be able to connect directly to databases, APIs and spreadsheets where a lightweight view is preferred.
Screens sign in using service accounts controlled by the enterprise identity provider. Row level security applies, so the same report shows different data in different locations. Conditional access policies need to be planned for shared devices. Content and management traffic should be encrypted, and the platform should provide audit logs.
A cloud based digital signage platform allows hundreds or thousands of screens to be managed centrally, with screen groups by region, function and site. Players should keep showing content during network interruptions and report their status continuously.
Decide early who can publish to which screens. Corporate communications, operations, HR and local site managers all have legitimate content, and the platform should support delegated permissions so that control is distributed without becoming chaotic.
Agree a standard screen and player specification for each type of location (reception, operations floor, executive area, store). Standardisation simplifies procurement, support and spares.
1. Start with one function where the value is obvious, such as customer service or logistics.
2. Define a small set of KPIs, their owners and their data sources.
3. Install a pilot at one or two sites using the agreed hardware standard.
4. Measure the effect on response times, meeting time or reporting effort over a quarter.
5. Use the pilot results to build the business case and template for wider rollout.
6. Roll out by region, using digital signage cloud software so that each new site is configured centrally rather than by a visiting engineer.
Planning a multi site rollout? Complete the short form and MRG Systems will prepare a written proposal covering pilot, hardware standards, cloud platform, installation and support.
• Showing too much. Screens with dozens of visuals are ignored. Six clear figures per screen is a good limit.
• Ignoring refresh limits. Different sources refresh at different rates. Show the last update time on every screen.
• Public links. Publish to web style features are not appropriate for internal data. Use signed in access.
• Domestic hardware. Consumer TVs and cheap streaming sticks fail early under continuous use.
• No content owner. Every screen group needs a named person responsible for what it shows.
It is software that presents dashboards and reports from enterprise analytics platforms on wall screens, manages those screens centrally, and keeps the content live. It complements rather than replaces tools such as Power BI or Tableau.
Usually not. Existing dashboards can be shown as they are. Many enterprises create simplified wall display versions of key reports for readability, but this is a design task rather than a rebuild.
Screens use service accounts under the control of the enterprise identity provider. Row level security applies, so each site sees only its own data. Management is through a cloud based digital signage platform with role based permissions and audit logs.
Yes. Digital signage solutions typically schedule analytics alongside internal communications, safety messaging and, in stores, retail digital signage content for customers.
Digital signage cloud software is designed for hundreds or thousands of screens. Screen groups, templates and delegated permissions keep large estates manageable.
A pilot at one or two sites can be live within weeks of approval. Regional rollouts are then planned in phases, usually aligned to site readiness for power, network and mounting.
Enterprises do not lack data. They lack shared, constant, effortless visibility of the data that matters. Business analytics display software provides exactly that, and it does so using the analytics platforms the organisation already owns. Start with one function, prove the effect, and scale with a platform built for many sites.
Talk to MRG Systems about enterprise analytics displays. Fill in the form below and we will respond within one working day.