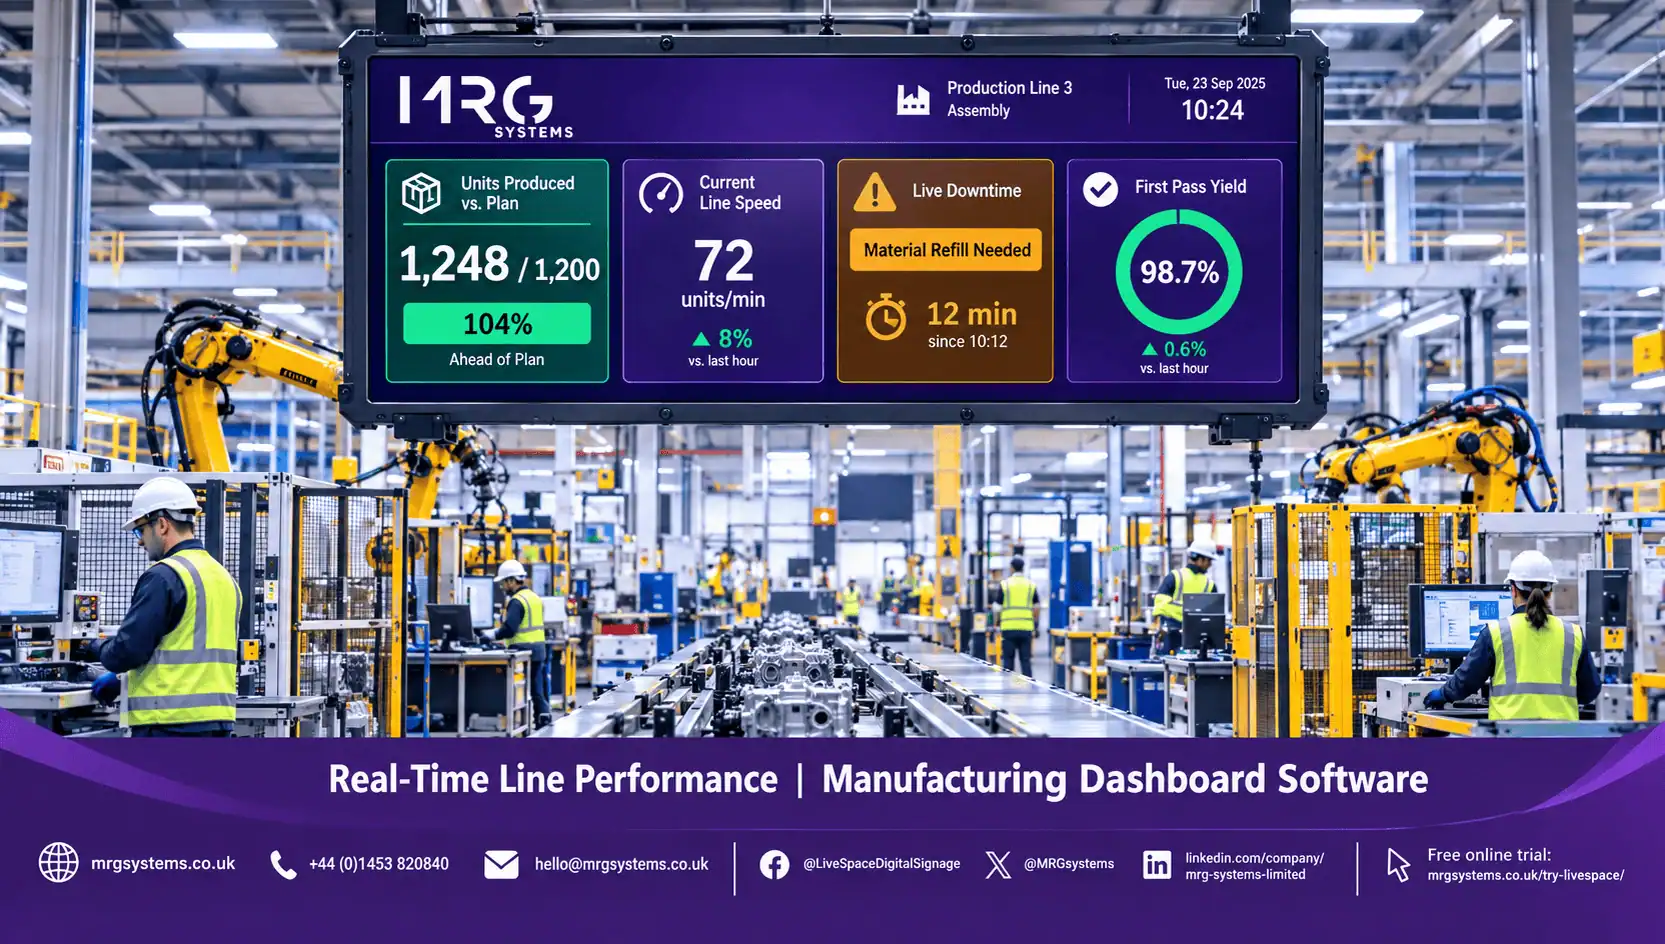
Manufacturing dashboard software shows live production data on screens across the factory, so that operators, team leaders and managers can see output, downtime, quality and safety as they happen and respond in the same shift. It is the modern form of the andon board and the shift whiteboard, drawing data automatically from machines, the ERP and the quality system rather than relying on someone with a marker pen.
This guide explains what manufacturing dashboard software does, which measures to show, how to connect machine and business data, how to design screens that can be read across a busy production hall, and how UK manufacturers typically roll it out. MRG Systems installs and supports screen based systems for industrial sites across the UK, and the recommendations below come from that experience.
A manufacturing dashboard has three parts.
• Data collection: signals from machines (through PLCs, OPC UA, SCADA or a manufacturing execution system), orders and schedules from the ERP, quality checks and downtime reasons entered by operators.
• Calculation: turning raw signals into the measures the site cares about, such as units per hour, OEE, scrap rate, changeover time and adherence to schedule.
• Display: showing those measures on large screens at the line, in the cell, at the team board and in the office, updated continuously.
The display part is often handled by digital signage software, which manages every screen from one console and lets the site mix production data with safety notices, shift information and company announcements.
A line that slows at 10:15 is spotted on the screen at 10:16, not in the shift report at 18:00. Team leaders walk over, find the cause and resolve it, which protects the day’s output.
Lean manufacturing relies on making performance visible so that abnormal conditions stand out. Manufacturing dashboard software provides a live version of the traditional visual board, with no manual updates and no risk of the board being wrong.
When production, quality, planning and finance each hold their own figures, meetings turn into reconciliation exercises. A single dashboard with agreed definitions removes that friction.
When a team can see its own output against target through the shift, engagement rises. Operators start asking why the line is behind and suggesting fixes, rather than waiting for a supervisor.
When a changeover improvement is introduced, the effect is visible on the screen the next day. That evidence makes the next project easier to justify.
Want to see live production data on a screen in your factory? Fill in the short enquiry form and we will build a demo using measures from your own site.
Keep it small. A screen that can be read in two seconds beats one that needs a minute.
• Units produced this shift against plan.
• Current rate against target rate.
• Downtime this shift, with the top three reasons.
• Scrap or first pass yield.
• Current job, next job and changeover due time.
• OEE for the line, shown as availability, performance and quality.
• Adherence to schedule.
• Open quality issues and actions.
• Safety: days since the last lost time incident, near miss count, today’s safety focus.
• Staffing and skills matrix for the shift.
• Plant level OEE and output trend.
• Order backlog and on time delivery.
• Cost of quality.
• Energy consumption per unit, which is increasingly important for UK manufacturers reporting on sustainability.
Most factories have data spread across several systems. The practical approach is:
1. Start with what already exists. Many sites have an ERP, a spreadsheet based production log and machine counters that are not connected to anything. A dashboard that shows plan against actual from the ERP and the log is a good first step.
2. Add machine signals where they pay for themselves. Run status, cycle count and stop reason from the PLC unlock live OEE. A site does not need every signal from every machine on day one.
3. Capture downtime reasons at the line. This is where interactive digital signage earns its place: a touch screen at the end of the line where the operator taps the reason for a stop. Reason codes entered at the moment of the stop are far more accurate than those recalled at the end of the shift.
4. Agree definitions. OEE, scrap and downtime need clear, written definitions that everyone accepts. Without this, the dashboard becomes a source of argument.
Factory environments are hard on screens and on readability.
• Size and distance: a 55 inch screen is comfortable from about eight metres for large figures. Beyond that, use a larger screen or more of them.
• Contrast and colour: use very large numbers, strong colour coding (green on target, amber at risk, red behind) and plain backgrounds. Avoid fine detail.
• Environment: commercial displays with higher brightness handle bright halls better. Enclosures protect screens from dust, moisture and impact in harsh areas.
• Mounting: mount high enough to be seen over racking and equipment, but not so high that people need to crane their necks.
• Sound: some sites use a short tone or flashing border when a line stops, in the same way an andon light works.
A medium sized factory can easily have fifteen or twenty screens. Managing them individually is not practical. Digital signage software allows the site to:
• Group screens by line, cell, department and building.
• Schedule different content by shift.
• Show company wide messages on every screen at once, such as a safety alert or a visitor announcement.
• See which screens are online from the office.
• Push a layout change to every line screen in a few minutes.
Manufacturers with several sites use cloud based digital signage programs so that group level KPIs and standard layouts are managed centrally while each site keeps control of its own local content.
Running more than one site or more than a handful of screens? Complete the form and MRG Systems will prepare a written proposal covering software, screens, enclosures, installation and support.
5. Pick one line, ideally one with a known performance problem.
6. Agree five measures and their definitions with the line team.
7. Connect the data that already exists, and add machine signals only if they are needed for those five measures.
8. Install one screen where the team already meets at shift start.
9. Run it for a month, adjust the layout with the team, and record what changed.
10. Use that result to plan the next lines.
Sites that begin this way tend to find that other lines ask for screens before the project team gets to them.
It is software that collects production, quality and machine data, calculates measures such as OEE and output against plan, and shows them on screens around the factory in real time. It usually works alongside digital signage solutions that manage the screens and mix production data with other site communications.
Not necessarily. Many sites start with ERP and production log data, then add machine signals from existing PLCs where the benefit is clear. Older machines can be fitted with simple counters or sensors if needed.
OEE multiplies three factors: availability (running time against planned time), performance (actual rate against ideal rate) and quality (good units against total units). Each factor should be defined in writing for the site before it is displayed.
Yes. Interactive digital signage at the line allows operators to log downtime reasons, quality checks and changeover completion by touch, which improves the accuracy of the data behind the dashboard.
Commercial displays and protective enclosures are designed for dust, temperature variation and long operating hours. A survey of each location identifies where enclosures are needed.
Cost depends on the number of screens, the machine connections required and whether enclosures are needed. A single line pilot is a modest investment and provides the evidence to plan the rest of the site. Ask for a proposal based on a site survey rather than a list price.
Manufacturing dashboard software works for one reason: it makes production performance visible to the people who can change it, while there is still time to change it. Start with one line and five measures, involve the team in the layout, and let the results make the case for the rest of the factory.
Ready to improve factory performance with live dashboards? Fill in the form below to request a free demo or a site survey from MRG Systems.