Nagios is rolled out to manage services
At MRG, our systems manage more than 56,000 screens every day. To support our clients and to make this efficient we need to know what is happening to the equipment out in the field. For this, we use Nagios to monitor the hosts and services. There are currently 175 servers being monitored by the system. There is an on-going roll-out programme to address the remaining business critical servers, but this is just a small part of the total number in the field. Our biggest clients have their own IT support teams with protocols that deliver a similar service to their business. What is Nagios?
- Nagios is an open source tool developed to inform us of any incidents on the system. Very often, this is even before the end-user is aware of them
- We specify which hosts and services it watches, and an email alert is sent when behaviour is unexpected or metrics cross a pre-defined threshold
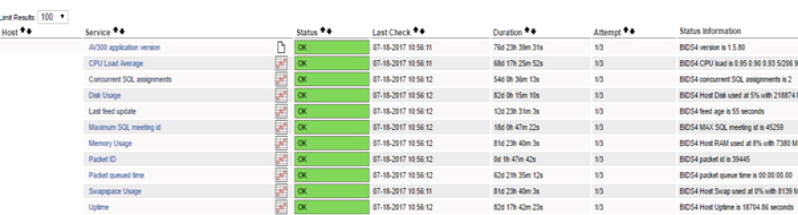
- We monitor CPU usage, disk space, data queues, log files, feed information, swap usage and other parameters are checked
- Nagios provides a historic record of data with a graphical representation to absorb the information quickly
Nagios is composed of three parts:
- A Scheduler - this is the server part of Nagios At regular intervals, the scheduler checks the plugins and provides performance data
- A GUI - the interface of Nagios (with the configuration, the metrics generated by CGI)
- The Plugins - They are configured to check a service and return the result to the Nagios server