Live KPI dashboard display software takes the key performance indicators that a business already measures and shows them on wall screens in real time, so that every team can see how the day is going while there is still time to change it. Manufacturers use it on the factory floor to track output, downtime and quality. Corporate teams use it in sales offices, contact centres and finance departments. In both cases the effect is the same: numbers that were hidden in reports become visible, shared and acted on.
This article explains how live KPI dashboard displays work, what changes when a business installs them, and how to choose live KPI dashboard display software that suits a UK manufacturing site or corporate office. MRG Systems has installed screen based systems across UK industry and corporate settings, and the points below reflect what we see working on site.
A KPI is a key performance indicator: a number that tells you whether the business is on track. Output per hour, order to dispatch time, first call resolution, sales against target and cash collected this week are all common examples.
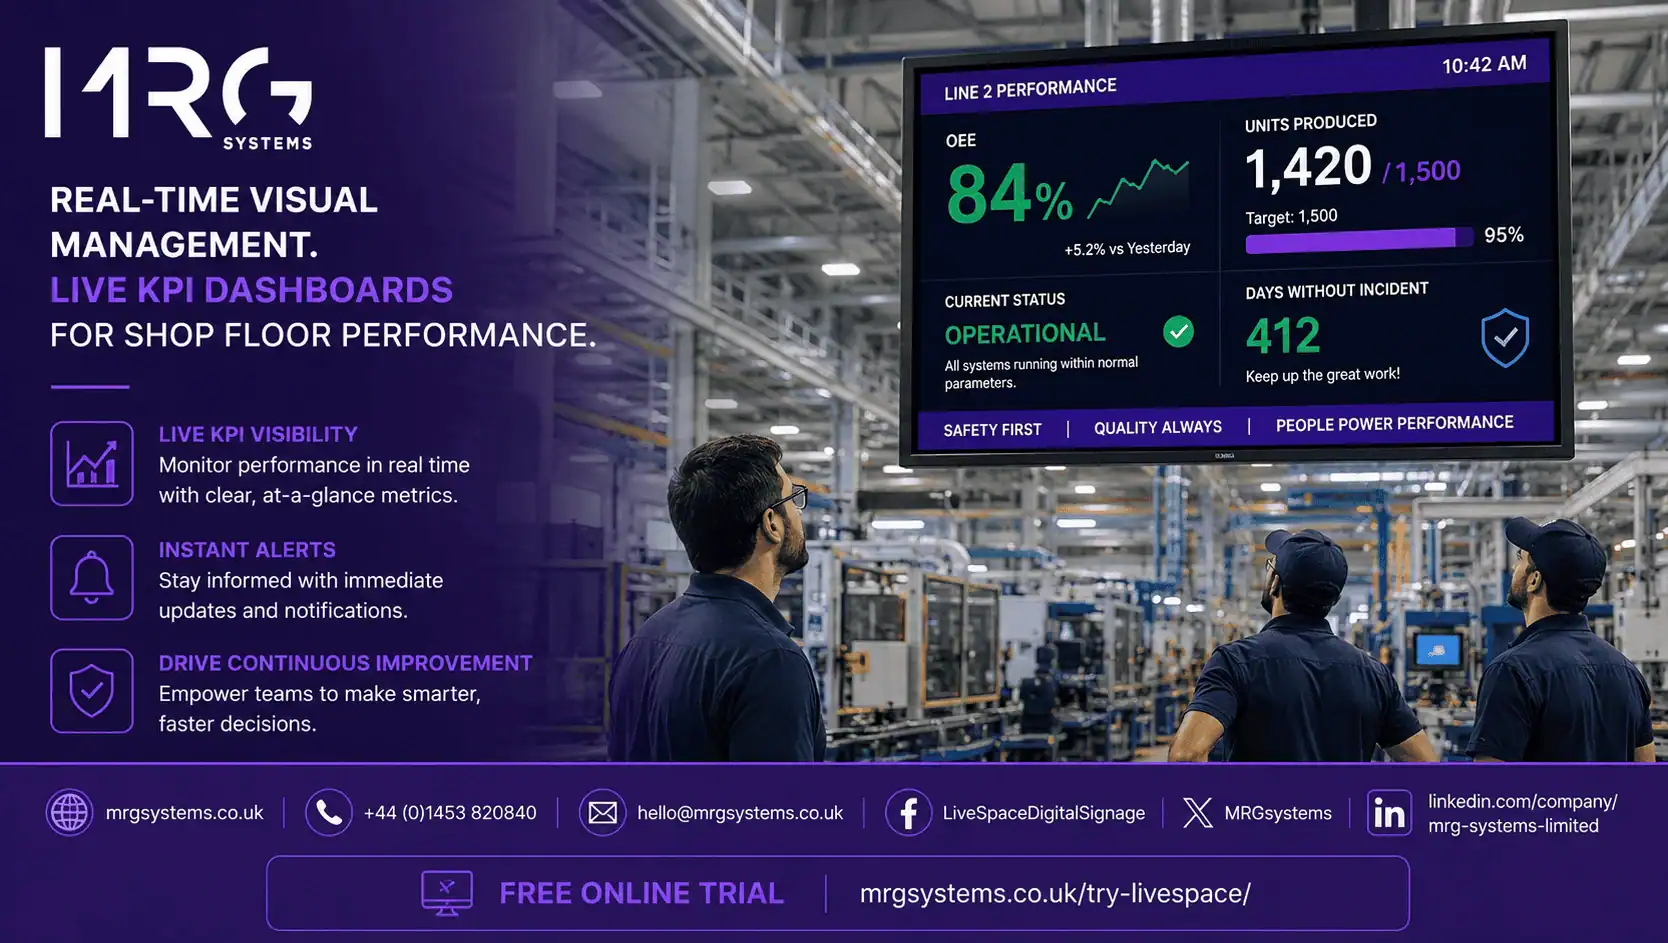
A live KPI dashboard display is a wall screen that shows those numbers as they change. The data comes from the systems you already run (an ERP, a production line PLC, a CRM, a helpdesk tool, a spreadsheet) and is refreshed automatically. Nobody prints anything. Nobody emails a report. The screen simply shows the truth as it stands right now.
Live KPI dashboard display software is the layer that makes this happen. It connects to the data, builds the view, sends it to each screen, and manages all of the screens from one central place. Many businesses run it as part of a wider set of digital signage solutions, so the same screens can also carry safety notices, shift information and company news.
There is a well known idea in lean manufacturing called visual management: if a problem is visible, it gets fixed faster. Andon boards, the coloured lights and counters used on production lines, are an early form of this. Live KPI dashboard displays are the modern, flexible version.
The same principle applies in an office. When a sales team can see the day’s pipeline on a KPI screen, the conversation shifts from “how are we doing?” to “what do we do about deal three?” When a contact centre can see the queue length and average wait, agents adjust without being told.
Would you like to see what a live KPI dashboard could look like for your site or office? Fill in the short enquiry form and we will build a demo using your own KPIs.
On a production line, a fall in output shows on the screen within minutes. The supervisor walks over, finds the cause and resolves it in the same shift, rather than reading about it in tomorrow’s report. In a Corporate Office Digital Signage setting, a spike in support tickets is seen by the whole team, not just the manager who receives the weekly summary.
When every team pulls its own figures into its own spreadsheet, meetings turn into arguments about whose number is right. A live KPI dashboard display draws from one source and shows one figure. The meeting can move on to decisions.
Managers in many UK firms spend hours each week building status reports. Once the data is live on a screen, most of that reporting stops. The time is spent on improvement instead.
Good dashboards show who owns each number. When a KPI is red and the owner is named, the conversation is short. This is not about blame; it is about making sure that every measure has someone paying attention to it.
People like to know how they are doing. Teams that can see their output, their quality score or their sales against target tend to take more interest in the result. Adding a rolling message, a shout out for a good shift or a safety reminder alongside the KPIs keeps people looking at the screen.
Improvement projects often fail because nobody can see whether they worked. When the KPI is on the wall before, during and after a change, the effect is obvious to everyone. That builds support for the next project.
• Units produced against plan, by line and by shift.
• Overall equipment effectiveness (OEE), which combines availability, performance and quality into one figure.
• Downtime, with the top reasons.
• Scrap and rework rates.
• Safety information, including days since the last lost time incident.
• Sales pipeline, bookings and revenue against target.
• Contact centre queue, average wait time and first contact resolution.
• Finance figures such as cash collected, invoices overdue and month end progress.
• Project status for delivery teams.
• Customer satisfaction scores.
In both cases, the rule is to show fewer numbers than you think you need. A screen with six clear KPIs is read; a screen with thirty is ignored.
Make sure the software connects to your existing systems. On a manufacturing site this may include the ERP, the MES and machine data through OPC UA or a SCADA system. In an office it is more likely to be a CRM, a helpdesk platform and Excel or Google Sheets. If your KPIs already live in Power BI, Tableau or Looker Studio, the display system should show those dashboards directly.
Look for digital signage software that manages every screen from one browser based console. You should be able to group screens by site, department or line, schedule what each group shows by time of day, and see immediately if a screen stops responding.
Screens on a factory floor are often viewed from ten metres or more, sometimes through safety glasses, in variable light. Layouts need very large figures, strong colour contrast and no clutter. Corporate screens can carry a little more detail, but the same rules apply.
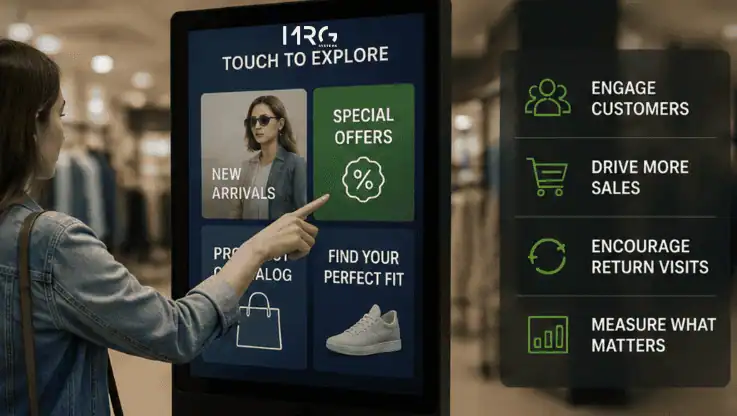
Most KPI screens are view only. In some settings, though, interactive digital signage Corporate office adds value: a touch screen at the end of a line where an operator can log a downtime reason, or a screen in a meeting room where a manager can drill into a figure during a huddle.
Domestic TVs are not designed for sixteen hours a day in a dusty environment. Commercial displays and rugged media players cost more up front but fail far less often. A supplier who provides the whole package, including installation and support, removes the finger pointing that can happen when hardware and software come from different companies.
Ask MRG Systems for a written proposal covering software, screens, installation and support. Complete the enquiry form and we will respond within one working day.
1. Pick one area, such as a single production line or one sales team.
2. Agree the five or six KPIs that matter most in that area and where the data comes from.
3. Install one screen where the team already gathers for daily briefings.
4. Review the screen with the team after two weeks and adjust the layout.
5. Roll out to the next area using what you learned.
Most businesses find that the first screen sells the second. Once one team has live figures, the others ask for the same.
It is software that connects to your business systems, builds a clear view of your key performance indicators, and shows that view on wall screens in real time. It usually includes tools to manage many screens from one place and to mix KPIs with other content such as notices and news.
Reporting tools are designed to be opened on a laptop when someone wants to analyse something. Live KPI dashboard display software is designed to be seen without effort, by many people, all day. The emphasis is on readability from a distance, automatic refresh and central screen control.
Usually not. Good digital signage software can display Power BI, Tableau and Looker Studio dashboards as they are. You may want to create a simplified version for wall screens, but that is a layout choice, not a rebuild.
It depends on the source. Machine data can update every few seconds. CRM and finance systems may update every few minutes or on a schedule. The screen should always show the time of the last update so that nobody is misled.
Yes. Most digital signage programs allow you to schedule KPIs alongside safety notices, shift patterns, company news, weather and video. This keeps screens interesting and keeps people looking.
Costs depend on the number of screens, the data connections needed and whether you buy or rent the hardware. A single screen for one team is a modest investment. Multi site rollouts benefit from per screen pricing. Ask for a quote based on your real screen count.
Live KPI dashboard displays are not about technology for its own sake. They work because they make performance visible, and visible performance improves. Whether you run a factory in the Midlands or a sales office in London, the same rule applies: put the numbers where people can see them, keep them live, and act on what they show.